What Is Technical Analysis in Forex Trading?
If you're new to Forex trading, you've likely heard the term technical analysis mentioned frequently. But what exactly does it mean? Technical analysis is a method of evaluating currency pairs by studying historical price data, chart patterns, and trading indicators. Unlike fundamental analysis that focuses on economic news and events, technical analysis assumes that all market information is already reflected in the price. This beginner-friendly guide will explain what technical analysis is, why traders use it, and how you can start applying it to your own trading decisions.
Understanding Technical Analysis Basics
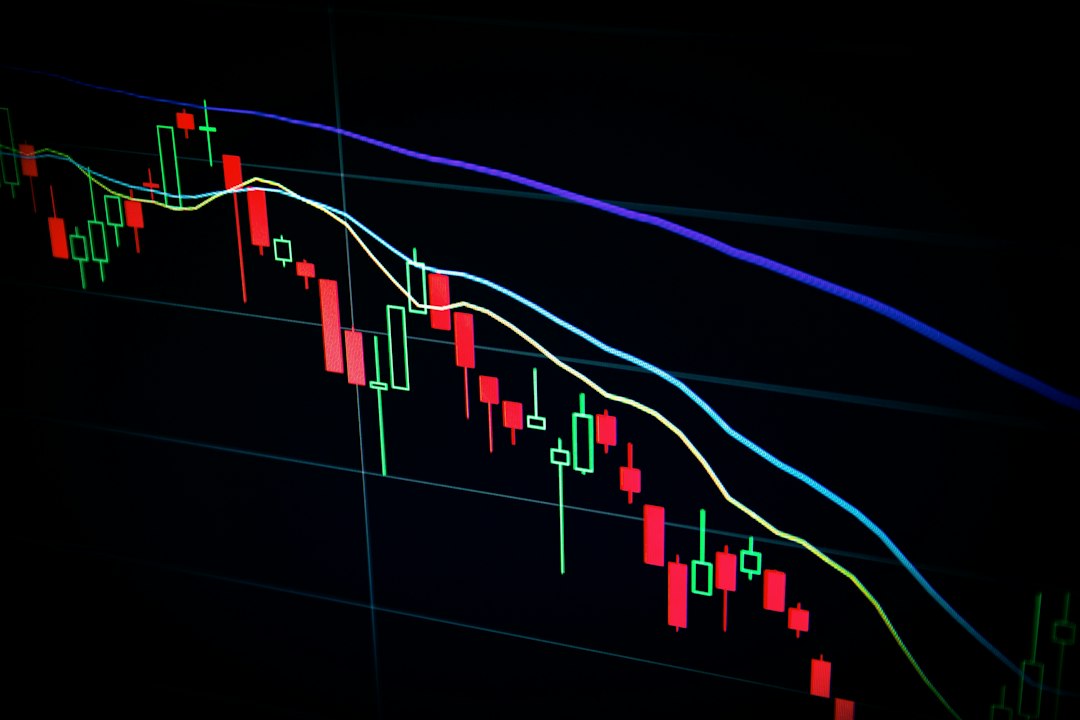
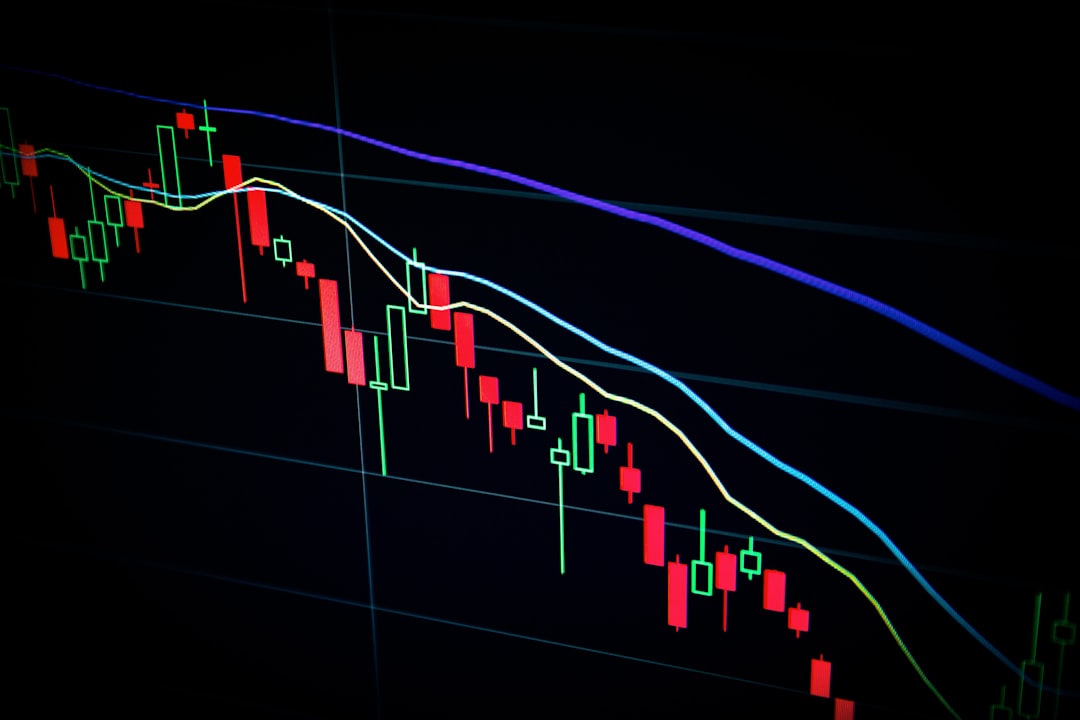
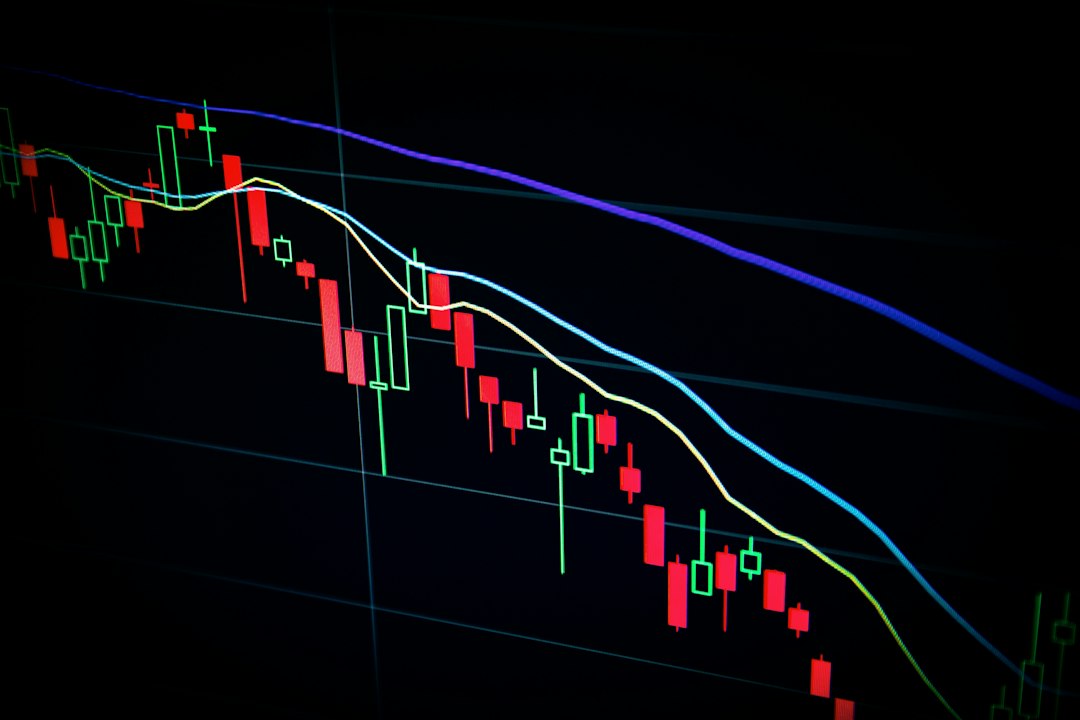
Technical analysis is the study of price movements and trading volume to forecast future market behavior. The core belief behind technical analysis is that price patterns and trends repeat themselves over time because human psychology drives market behavior. When traders use technical analysis, they examine charts to identify support and resistance levels, trend directions, and potential entry and exit points. This approach helps traders make decisions based on what the market is actually doing, rather than predicting what it should do based on economic theory. For beginners, technical analysis provides a visual and systematic way to understand market dynamics without needing deep knowledge of global economics or monetary policy.
Key Components of Technical Analysis
Technical analysis relies on three main components that work together to give traders a complete picture of market conditions. First, price charts display historical price movements in various formats like candlestick, bar, or line charts. Second, technical indicators are mathematical calculations based on price and volume that help identify trends, momentum, and volatility. Third, chart patterns are recognizable formations that suggest potential future price movements. Understanding these components helps beginners structure their analysis systematically:
- Price action: The actual movement of price over time, forming the basis of all analysis
- Volume: The number of currency units traded, indicating the strength behind price moves
- Timeframes: Different chart periods (1-minute, hourly, daily) that reveal short-term and long-term trends
- Support and resistance: Price levels where buying or selling pressure historically increases
Common Technical Analysis Tools
Beginners can choose from hundreds of technical indicators, but starting with a few proven tools makes learning easier. The table below shows some of the most popular technical analysis tools and their primary purposes:
| Tool | What It Shows | Best Used For |
|---|---|---|
| Moving Averages | Average price over time | Identifying trend direction |
| RSI (Relative Strength Index) | Overbought/oversold conditions | Spotting potential reversals |
| MACD | Momentum and trend strength | Confirming trend changes |
| Fibonacci Retracement | Potential support/resistance levels | Finding entry/exit points |
| Bollinger Bands | Price volatility | Identifying breakout opportunities |
Each tool serves a specific purpose, and successful traders often combine multiple indicators to confirm their trading decisions. The key is not to use every indicator available, but to master a few that complement your trading style and provide consistent signals.
How Beginners Should Approach Technical Analysis
Starting with technical analysis can feel overwhelming, but taking a structured approach makes the learning process manageable. Begin by mastering basic chart reading before adding complex indicators. Practice identifying simple support and resistance levels on historical charts to understand how price reacts at key levels. Next, learn one or two indicators thoroughly rather than trying to use everything at once. Many successful traders build their entire strategy around just a handful of tools they understand deeply. Always remember that technical analysis is about probability, not certainty. No indicator or pattern guarantees future price movement, which is why risk management remains essential even when using technical analysis. Combine your technical skills with proper position sizing and stop-loss orders to protect your trading capital while you learn.
Limitations and Realistic Expectations
While technical analysis is a valuable tool, beginners must understand its limitations. Technical analysis works best in liquid markets with clear trends, but can produce false signals during choppy or low-volume conditions. Additionally, self-fulfilling prophecy sometimes occurs when many traders act on the same technical signal, temporarily making predictions come true. Past price performance doesn't guarantee future results, and unexpected news events can instantly invalidate technical setups. Successful technical traders combine chart analysis with awareness of upcoming economic releases and market sentiment. They also understand that technical analysis is a skill that improves with practice and experience, not something mastered in a few days or weeks.
Technical analysis gives Forex beginners a practical framework for understanding price movements and making trading decisions based on observable data rather than guesswork. By starting with basic chart reading, learning a few essential indicators, and practicing on historical data, you can gradually develop the skills needed to analyze currency pairs effectively. Remember that technical analysis is one tool in your trading toolkit—combine it with proper risk management, continuous education, and realistic expectations for the best chance of long-term trading success. Start small, practice consistently, and let your technical analysis skills develop naturally over time.