How to Read Forex Charts as a Beginner Trader
Reading Forex charts can feel overwhelming when you first start trading currencies. Those colorful lines, bars, and candlesticks may look like a foreign language, but understanding chart basics is essential for making informed trading decisions. In this guide, you'll learn the fundamental components of Forex charts, how to interpret price movements, and which chart types work best for beginners starting their trading journey.
Understanding the Three Main Chart Types
Forex traders use three primary chart types to visualize currency price movements. Each chart type presents the same market data differently, and choosing the right one depends on your trading style and experience level.
Line charts are the simplest format, connecting closing prices with a continuous line. They provide a clean overview of price trends without extra detail. Bar charts show more information by displaying the open, high, low, and close prices for each time period using vertical bars with small horizontal lines. Candlestick charts are the most popular among traders because they present the same information as bar charts but with colored bodies that make price movements easier to read at a glance.
| Chart Type | Information Shown | Best For |
|---|---|---|
| Line Chart | Closing prices only | Quick trend overview |
| Bar Chart | Open, high, low, close | Detailed price analysis |
| Candlestick Chart | Open, high, low, close with visual color coding | Pattern recognition and trend analysis |
Decoding Candlestick Patterns for Beginners
Candlestick charts have become the standard for Forex traders because they provide immediate visual information about market sentiment. Each candlestick represents price movement during a specific time period, whether that's one minute, one hour, or one day.
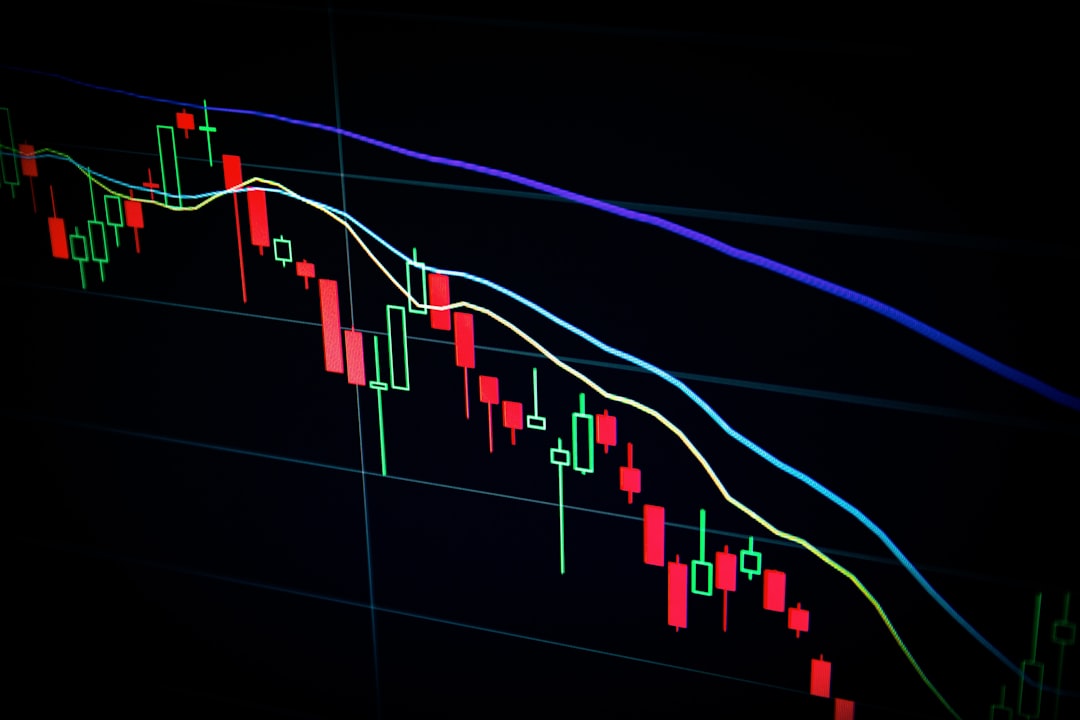
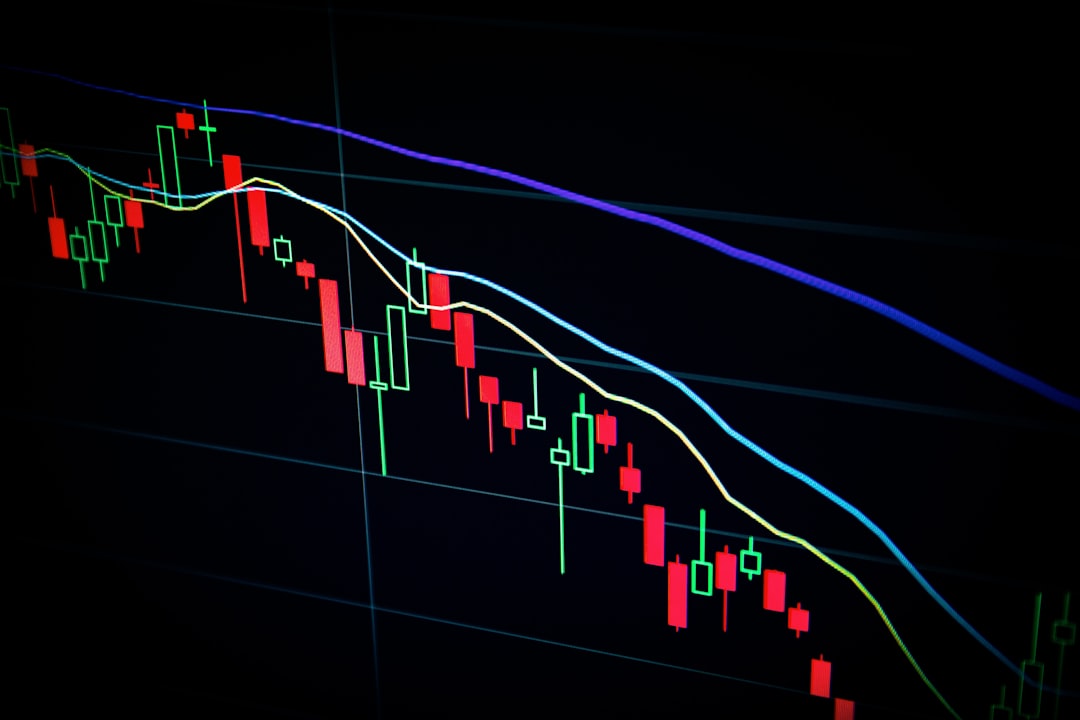
A candlestick has a body (the thick part) and wicks or shadows (the thin lines above and below). The body shows the opening and closing prices, while the wicks show the highest and lowest prices reached during that period. Green or white candlesticks indicate the price closed higher than it opened (bullish movement). Red or black candlesticks show the price closed lower than it opened (bearish movement).
For beginners, focus on understanding single candlestick formations before moving to complex patterns. A long green body suggests strong buying pressure, while a long red body indicates strong selling pressure. Small bodies with long wicks often signal market indecision or potential reversals.
Selecting the Right Timeframe for Your Trading Style
Forex charts can display price movements across multiple timeframes, from one-minute intervals to monthly views. The timeframe you choose should match your trading strategy and how much time you can dedicate to monitoring the markets.
Short-term timeframes (1-minute to 15-minute charts) are used by day traders who open and close positions within a single trading session. Medium-term timeframes (1-hour to 4-hour charts) suit swing traders who hold positions for several days. Long-term timeframes (daily, weekly, monthly charts) help position traders identify major trends for trades lasting weeks or months.
As a beginner, start with daily charts to learn how to identify trends without the noise and rapid changes of shorter timeframes. Once you understand basic chart reading, you can experiment with multiple timeframes to confirm trading decisions—a technique called multiple timeframe analysis.
Reading Support and Resistance Levels on Charts
Support levels are price points where buying pressure typically prevents further price declines. Resistance levels are price points where selling pressure typically prevents further price increases. These levels appear as horizontal zones on your chart where price has previously reversed direction multiple times.
To identify support and resistance, look for areas where price has bounced or stalled repeatedly. Draw horizontal lines connecting at least two or three price touches at similar levels. These zones become important reference points for planning your entry and exit strategies. When price breaks through a resistance level, that level often becomes new support, and vice versa—a concept called role reversal.
Remember that support and resistance are zones, not exact price points. Markets rarely respect precise numbers, so think of these levels as areas of interest rather than absolute barriers.
Common Mistakes Beginners Make Reading Charts
New traders often make predictable mistakes that can be easily avoided with awareness. Overcomplicating charts with too many indicators creates confusion rather than clarity. Start with clean charts and add tools gradually as you understand their purpose.
Ignoring the bigger picture is another common error. Always check higher timeframes to understand the overall trend before trading on lower timeframes. Trading against the major trend significantly reduces your probability of success.
Finally, beginners frequently mistake every price movement for a tradeable signal. Not every candlestick pattern or level touch requires action. Patience and waiting for high-probability setups based on clear chart signals distinguishes successful traders from those who struggle.
Understanding how to read Forex charts is a fundamental skill that takes practice to master. Start with simple candlestick charts on daily timeframes, learn to identify basic support and resistance levels, and avoid overcomplicating your analysis. As you gain experience reading price action, you'll develop the confidence to recognize patterns and make informed trading decisions based on what the charts are telling you.